See the record behind the number.
Review available acquisition data, document activity, operating totals, advertising performance, and local rank scans with the source history still attached.
Acquisition performance overview
Start with the complete campaign-performance view, then inspect attribution, document activity, financial context, and rank tracking below.
Evidence before interpretation
Follow the context that exists—and label what does not.
Analytics are useful when the underlying source, event, and date range remain visible. Mold Inspector keeps those records close enough for the office to verify before changing course.
- 01
Keep available source context
When source, medium, campaign, term, content, referrer, and landing-page data are captured, keep them on the submission and linked lead for later review.
- 02
Read the document history
Review saved versions and client activity with timestamps plus device and approximate location context when those values are available.
- 03
Review the operating period
Use the selected date range to compare income, expenses, net profit, outstanding revenue, advertising spend, and performance over time.
- 04
Compare local visibility
Run rank scans for the keywords and service areas you care about, then compare the resulting grid with earlier scans and named competitors.
Live / Evidence
Start with the populated detail, not a decorative KPI card.
These production views show the submission context and the all-time operating picture behind the summary—not illustrative people, dates, or funnel totals.
Use the left and right arrow keys to change screenshots. On a touch screen, swipe horizontally. Activate a screenshot to open its expanded view.
A submission arrives with connected records, acquisition context, preferred timing, service type, and the customer’s stated need.
1 / 2
Swipe to view
1 / 2
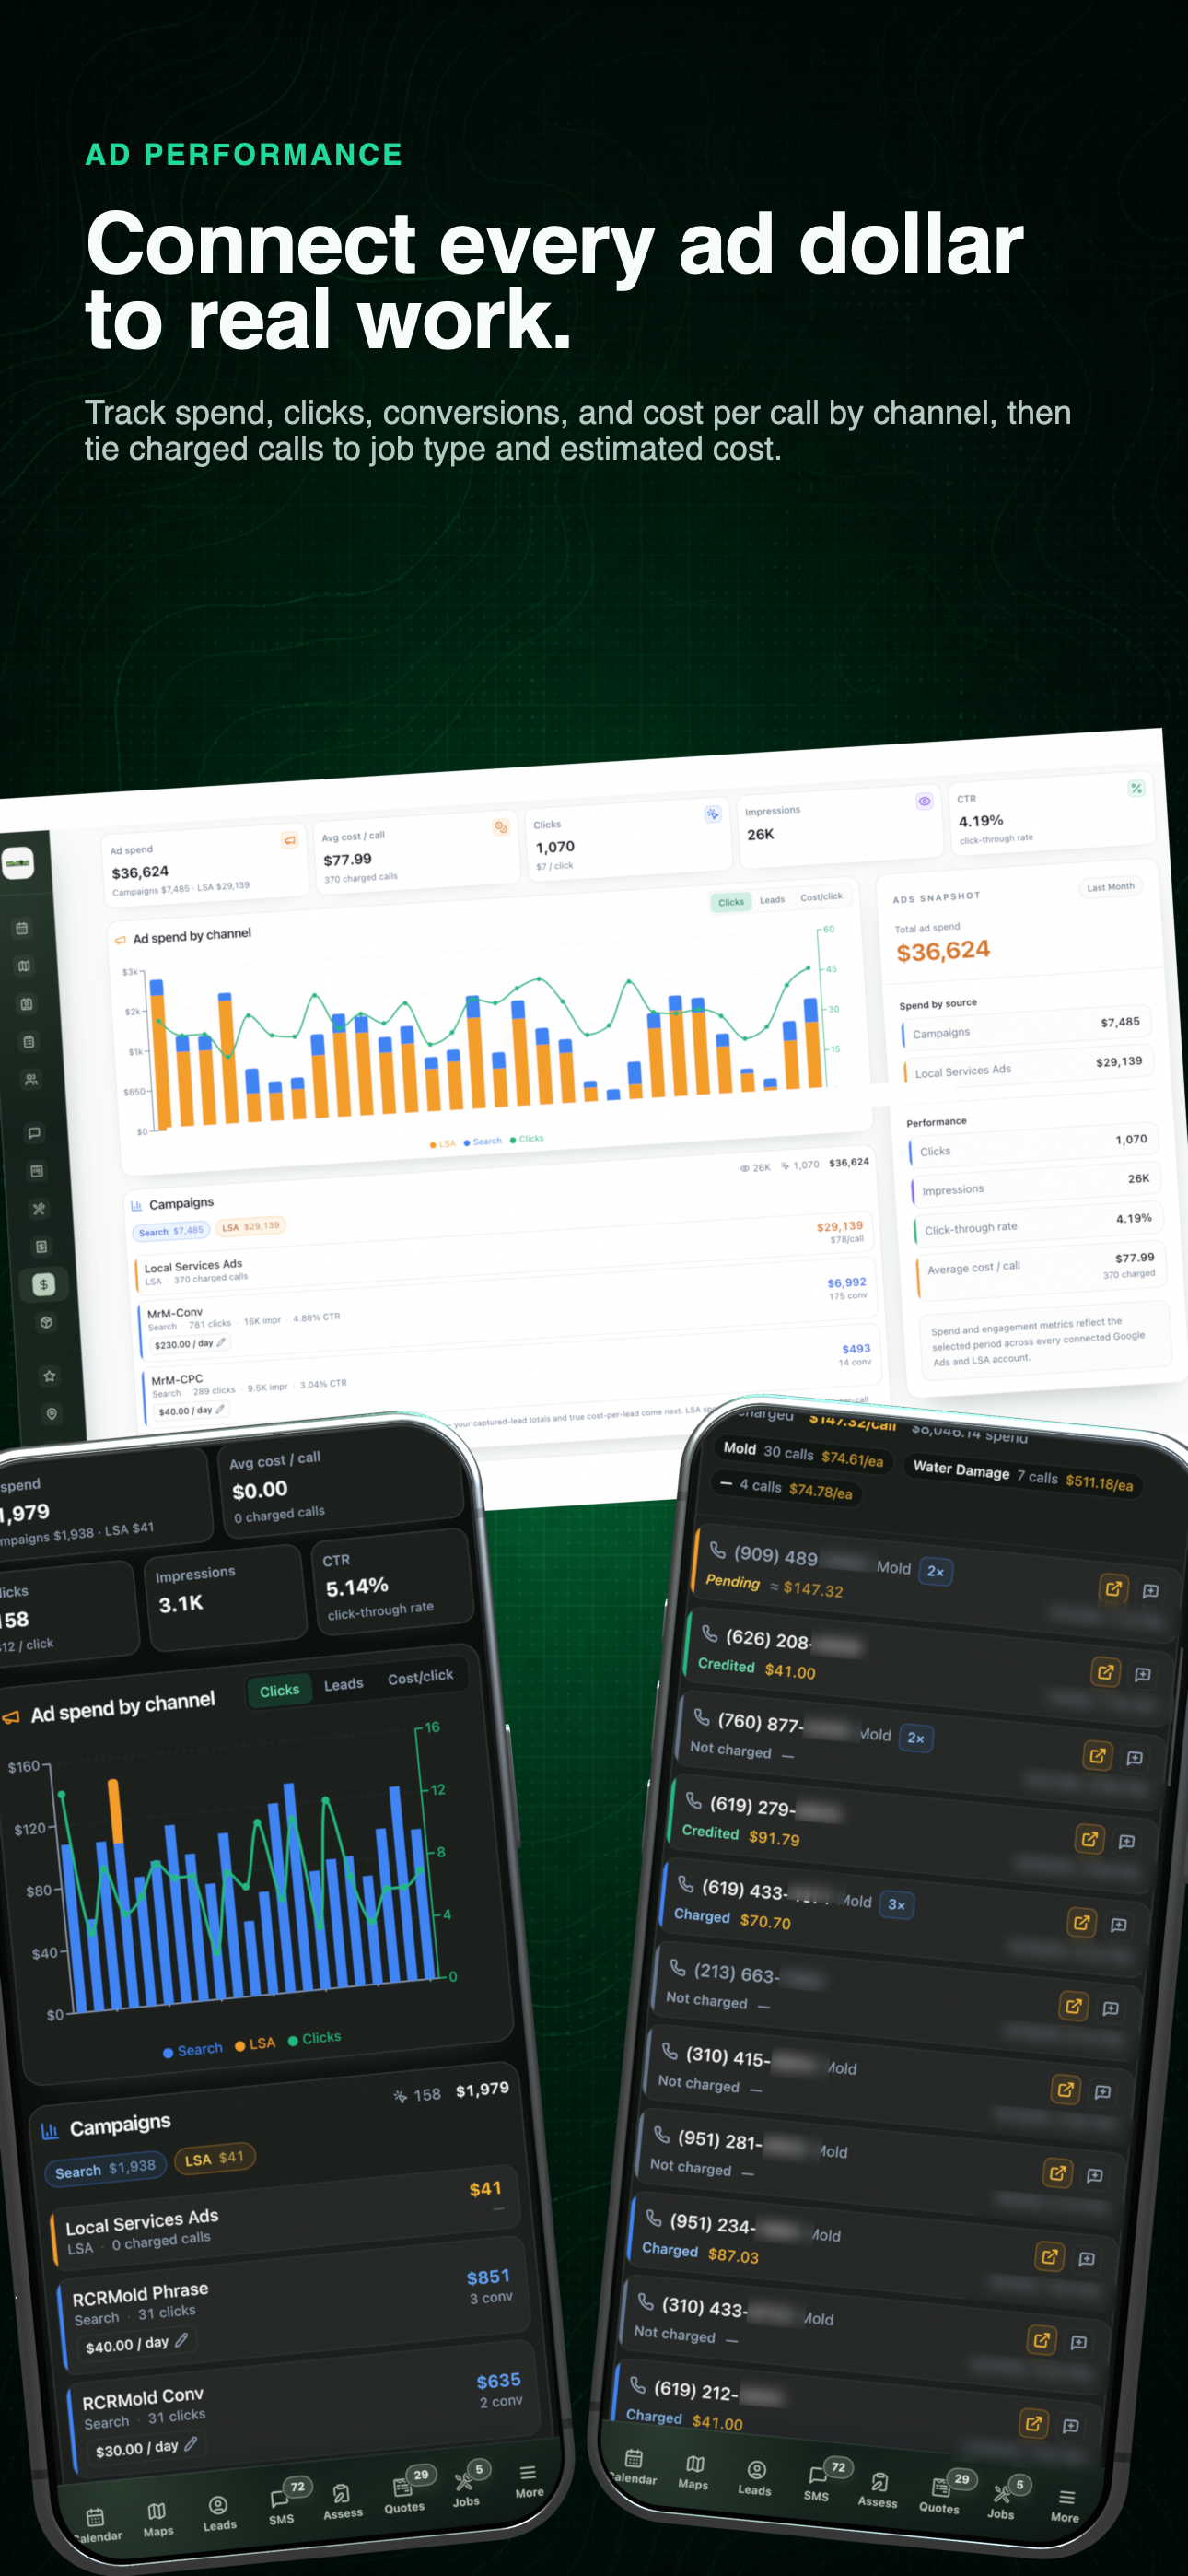
02 / Campaigns
Follow ad spend into the calls behind it.
Use the summary to orient the review, then move deeper into campaign performance and the attributed calls that explain the result.
- 01
Start with the selected period
Review available spend, calls, impressions, conversion rate, and channel mix with the date range still visible.
- 02
Open the campaign detail
Move from the blended totals into individual campaign and channel results before deciding what is actually changing.
- 03
Inspect the calls behind attribution
Where the source data exists, compare call status, job type, and estimated value instead of treating every attributed call as equal.
Use the left and right arrow keys to change screenshots. On a touch screen, swipe horizontally. Activate a screenshot to open its expanded view.
Read the period summary, channel mix, and individual campaign results in the same view.
1 / 2
Swipe to view
1 / 2
Local rank tracking
Check the competition. Keep the evidence.
A useful rank story shows more than a decorative map. Keep the selected term, completed field points, summary metrics, competitor list, and printable result together.
- 01
Choose the term and service area
Run the grid for the keyword, radius, density, and market that matter to the business rather than relying on one blended visibility score.
- 02
Read the completed field points
Compare average rank, top-three share of voice, top-ten coverage, and the individual map positions that make those percentages real.
- 03
Save the comparison
Use the report to document the grid, named competitors, and current result before comparing it with a later scan.
Use the left and right arrow keys to change screenshots. On a touch screen, swipe horizontally. Activate a screenshot to open its expanded view.
Keep each saved scan’s terms, market, grid coverage, radius, and date visible before opening the map.
1 / 3
Swipe to view
1 / 3
See your workflow, connected.
Bring the way you work today. We’ll show you what connects, what can be automated, and where the platform removes duplicate work.
0130-minute personalized walkthrough
02See pricing for your team size
03No obligations or pressure